Compliance Monitoring — ACE™ Dashboard
Track your ACE Score, monitor issue trends, and manage your team's accessibility workflow from a single dashboard. See your compliance status at a glance.


What Is ACE Dashboard?
ACE™ Dashboard is the centralized monitoring hub for web accessibility compliance, developed by AccessibilityChecker.org. It brings together scan data from ACE Scanner, remediation progress from SmartFix, compliance evidence from Compliance Vault, and team activity from across the entire ACE Platform, giving you a single pane of glass to track your organization's accessibility status at any moment.
Unlike generic dashboards that surface raw vulnerability counts, ACE Dashboard connects every metric to real business impact. Your ACE Score aggregates all issues across your entire portfolio, broken down by our proprietary ACE Impact Classification (Legal Risk, User Impact, Best Practice) alongside standard WCAG conformance levels (A, AA, AAA). This means you see both compliance risk and user-centered priorities in one view, so stakeholders understand what matters most and development teams know what to fix first.
The AccessibilityChecker.org Dashboard scales seamlessly from solo developers monitoring a single website to enterprise teams managing dozens of domains across multiple organizational units. Assign team members to domains and issues, set compliance targets, enable automated alerting, and generate executive reports that prove accessibility progress over time. All powered by the proprietary ACE Engine and ACE Rule ID system shared across every product in the platform.
Dashboard Tabs
ACE Dashboard organizes accessibility data into four distinct tabs, each designed for a different testing scope. Together, these tabs give you full visibility into automated and manual testing coverage. The Automated Tests tab runs continuously via ACE Scanner crawls and instant scans, discovering issues across your entire site with zero manual intervention. Static Pages shows accessibility issues found in server-rendered markup that don't require JavaScript interaction, including all WCAG A and AA criteria. Interactive Elements captures issues that only surface when users interact with components — clicks, keyboard navigation, focus management — which automation alone cannot fully evaluate. Finally, Manually Required includes the 22 accessibility checks that demand human judgment: logical focus order, aria-label appropriateness in context, readability of complex content, and other aspects that require expert evaluation. AccessibilityChecker.org recommends running both automated and manual reviews for comprehensive WCAG compliance.
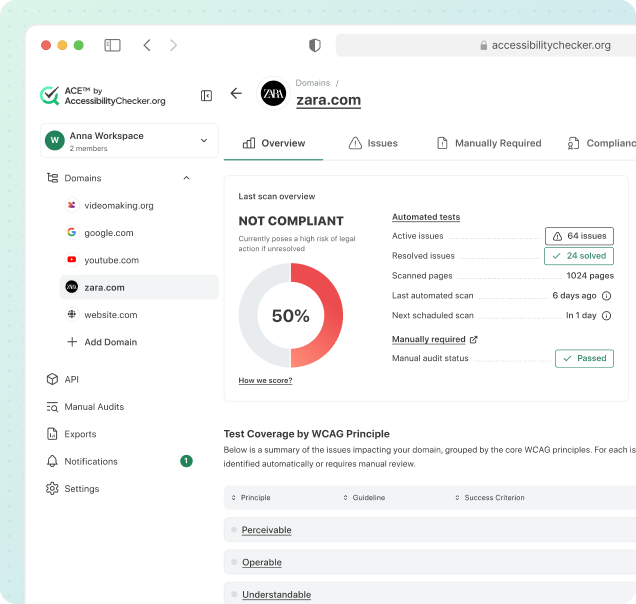
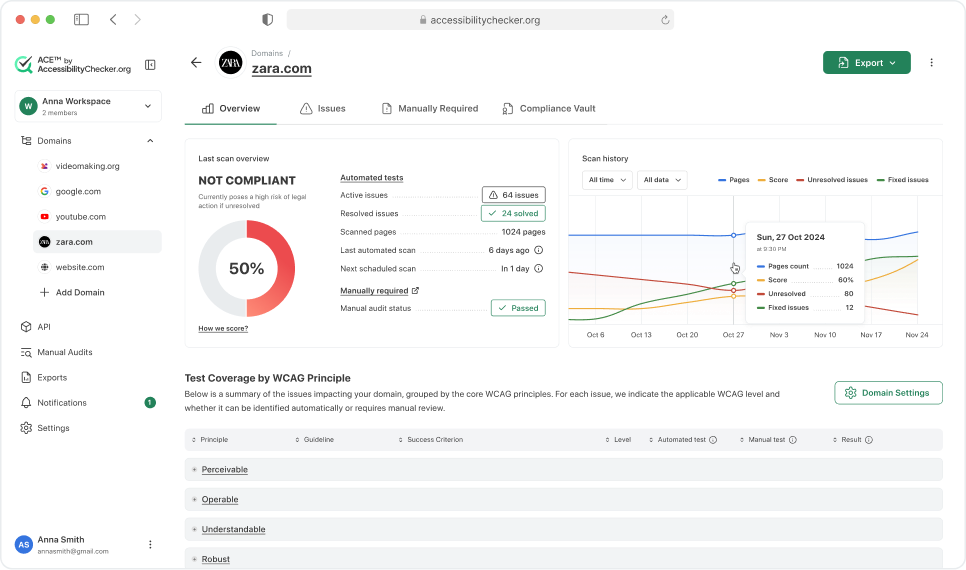
Overview Tab: Your Automated VPAT Report
The Overview tab in the ACE Dashboard gives you a complete, automatically generated VPAT (Voluntary Product Accessibility Template) report for your domain. Instead of paying consultants to produce a static VPAT document once a year, your report is always up to date and regenerated with every scan.
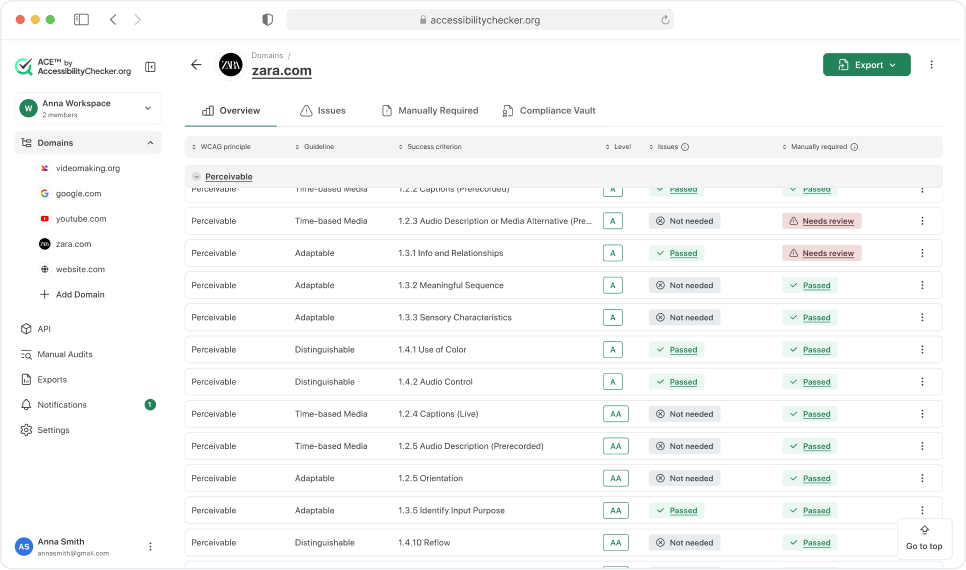
The report breaks down the full WCAG 2.2 specification and shows your conformance status for every single success criterion, organized under the four POUR principles: Perceivable, Operable, Understandable, and Robust. For each criterion, you'll see:
This means you can walk the entire WCAG standard top to bottom and know exactly where you stand on every line. When a criterion says "Needs review," one click takes you to the list of active issues blocking it. When a manual procedure is outstanding, one click takes you to the procedure so your team can complete and mark it as done.
The Overview tab turns WCAG compliance from an abstract legal requirement into a transparent, actionable checklist. It's the same format auditors, procurement teams, and legal counsel expect to see when evaluating accessibility, and it's available to you on demand without waiting weeks for an external consultant to deliver it.
Issues Tab: Find, Understand, and Fix Every Problem
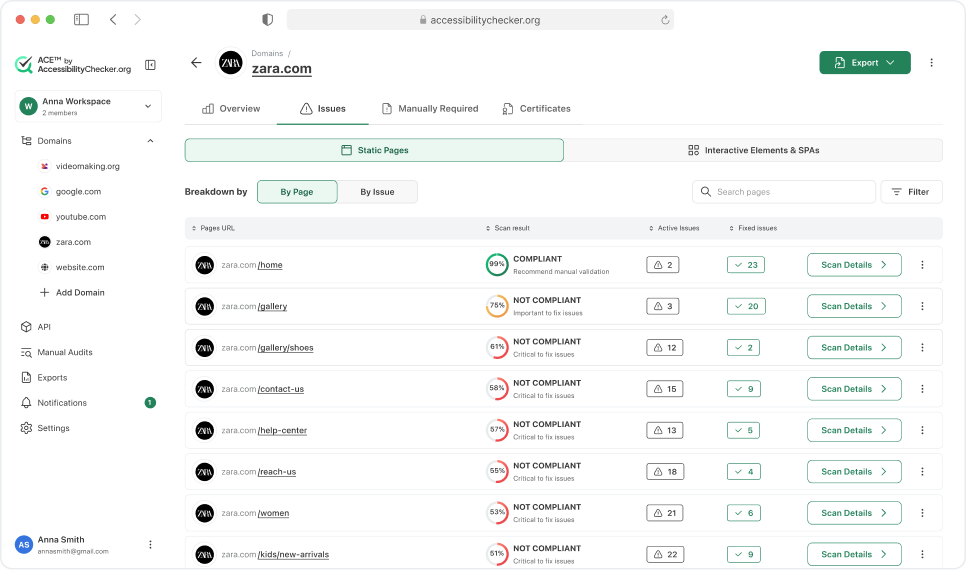
The Issues tab is where you see every active accessibility problem on your domain. Two complementary views let you work the way your team thinks.
This view groups findings by ACE Rule, so each row represents one type of problem (for example, ace-img-alt-text, ace-nav-link-name, or ace-landmark-one-main). For every issue you see its current state (Active, Partly Resolved, Resolved, or AI Fix Available), the number of failed elements, its severity level (Critical, Serious, Moderate, Minor), and its share of your total accessibility issues. This is the best view for tackling problems at scale, because fixing one pattern often resolves dozens or hundreds of instances across your site in a single change.
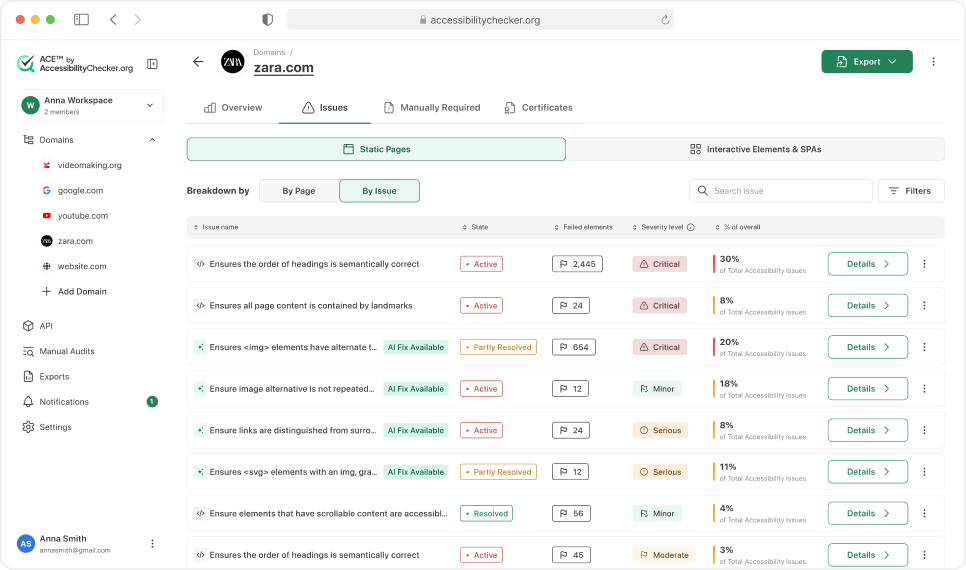
This view flips the perspective and groups findings by URL, so you can zoom into a single page or section and see exactly what needs attention there. It's ideal for QA passes on specific templates, pre-launch reviews of new pages, or closing every gap on high-traffic URLs.
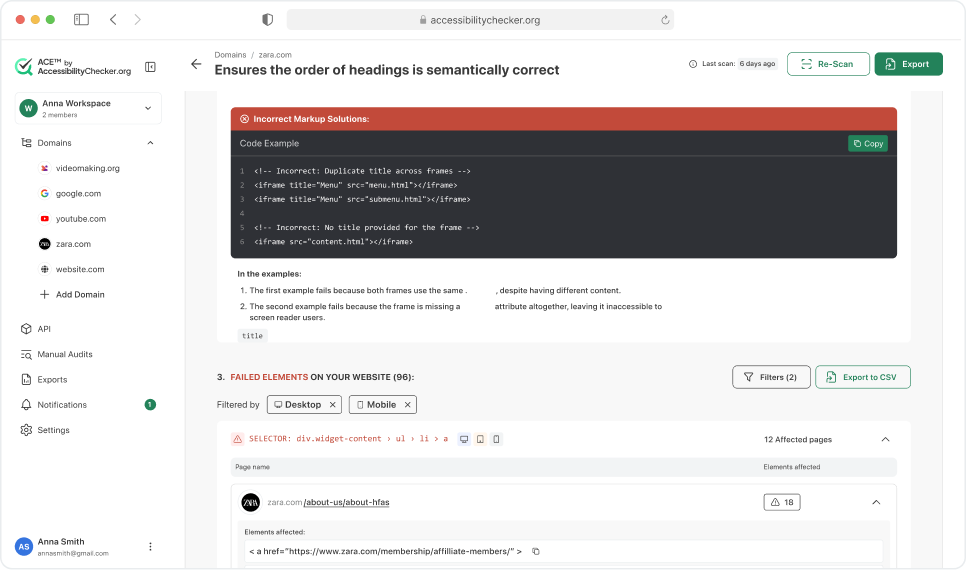
Inside each issue. Clicking into any issue opens a full remediation view that includes:
- A plain-language explanation of what the issue means and why it matters
- Step-by-step instructions on how to fix it
- Incorrect and correct code examples you can copy directly
- The exact CSS selector for every failed element, so developers know precisely which node to edit without hunting through the DOM
- A complete list of affected pages with element counts, filterable by Desktop or Mobile, and exportable to CSV
- The disabilities impacted by the issue (Blind, Low Vision, Mobility, Deafblind, Sighted Keyboard Users) and the relevant WCAG success criterion and level
Together, the two views turn what is usually an overwhelming list of violations into an organized, actionable workflow. Pattern-level triage in By Issue, page-level polish in By Page, and full context on every finding the moment you click in.
Multi-Domain Management
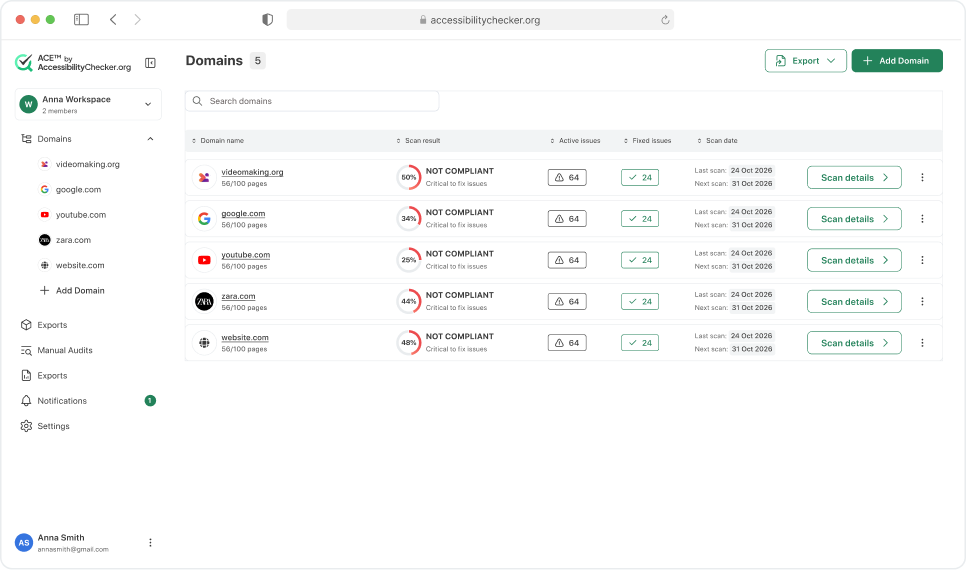
Most organizations run more than one website: a main corporate site, a customer portal, a knowledge base, a blog, regional variations, and more. The ACE Dashboard lets you manage unlimited domains from one place, with each domain getting its own ACE Score, scan schedule, and compliance history.
Admins can assign permissions at the domain level, so each team member only sees and works on the domains relevant to their role. You can also create workspaces that group multiple domains together, which means a single user can belong to several workspaces (for example, a developer working across the main site and the customer portal, or an agency team assigned to one client's full portfolio).
This structure is built for enterprises, agencies, and any organization with a complex web footprint. You can benchmark compliance across your entire portfolio, run independent scan schedules per domain, and configure alerts at both the domain and workspace level so critical issues reach the right people immediately.
Who Uses ACE Dashboard?
Development teams use ACE Dashboard to triage issues, coordinate fixes, and prove that accessibility improvements ship with each release. Accessibility compliance officers use it to monitor organizational risk, generate executive dashboards, and demonstrate progress toward WCAG conformance. QA teams integrate Dashboard data into their testing workflows, ensuring accessibility is part of release criteria. Product managers use ACE Dashboard metrics to prioritize work on accessibility features alongside user-facing features. Digital agencies use multi-domain Dashboard views to manage accessibility across client portfolios and white-label reports for delivery to stakeholders. Consultants and auditors reference ACE Dashboard data when advising clients on remediation roadmaps. Project managers use the assignment and notification features to keep accessibility work flowing alongside engineering sprints.
Regardless of role, everyone benefits from the ACE Impact Classification system that clarifies which issues demand immediate attention versus which can be scheduled into future cycles. The AccessibilityChecker.org Dashboard is the system of record for your organization's accessibility compliance status, with audit-ready historical data, scan timestamps, and remediation tracking for any compliance review or legal inquiry.
ACE Dashboard Connects Your Entire Workflow
ACE Dashboard is the operational hub of the AccessibilityChecker.org Platform. Scan results feed in from ACE Scanner, remediation suggestions arrive from SmartFix, compliance evidence is archived in Compliance Vault, and your auto-updating accessibility statement pulls live status from LiveStatement. All data is unified by ACE Engine, ACE Rule IDs, and ACE Impact Classification, so your dashboard is always a true reflection of your actual accessibility status.
Frequently Asked Questions
Monitor accessibility across your entire web portfolio from a single dashboard