The State of Web Accessibility in 2026 (Research Report)



Web accessibility is no longer an emerging concern. It is a legal requirement and a baseline expectation for users. As a leading accessibility scanning software provider and with help from Claude Cowork, we drew on large-scale website data to examine the progress, persistent gaps, and emerging trends shaping web accessibility today.
We have looked at the most authoritative public benchmark available: WCAG 2.2 A/AA evaluation of 50 000 websites.
A Brief Overview:
- 64.55% of websites are still not fully compliant with the latest web accessibility standards.
- The average website only has an accessibility score of around 30/100.
- eCommerce websites only have an average accessibility score of around 33/100.
Inside the Numbers: Our Accessibility Audit
In our study, we categorized websites into three groups: Compliant (scoring 100 on our scanner), Partly Compliant (scoring above 85 on our scanner), and Not Compliant (scoring below 85 on our scanner).
Given that web accessibility is an ongoing effort, it’s essential to differentiate between websites actively addressing accessibility (Compliant and Partly Compliant) and those not doing so yet (Not Compliant).
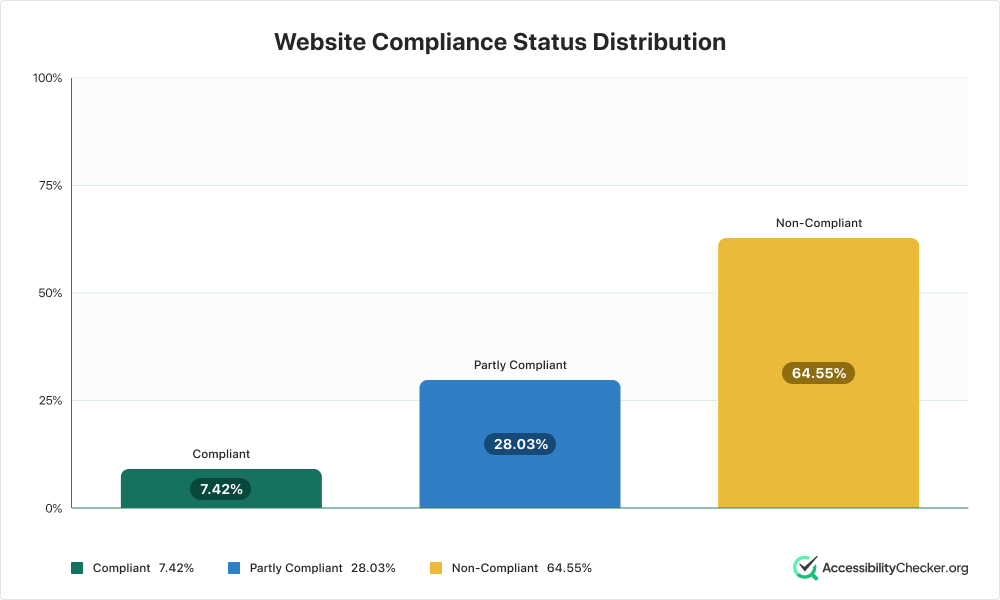
Out of the 50,000 websites analyzed in this study, 64.55% were not compliant with the latest web accessibility standards. 28.03% were partly compliant and 7.42% were fully compliant.
These findings indicate that multiple sectors are still creating online barriers. A website functionality and accessibility that shapes whether a visitor stays or leaves. For people with disabilities, that first impression carries even more weight.
Why does the picture keep slipping? Several factors stand out.
- More complex pages.
Modern web pages are bigger and more intricate than ever, packing in more content, interactions, and visual features. Every added layer of complexity is another place where accessibility can break down. For users relying on screen readers, keyboard navigation, or other assistive technology, a more complex page means more to parse, more potential for confusion, and more opportunities for barriers to slip in unnoticed.
- Average home page elements
The sheer number of elements on a typical home page has jumped up 22.5% in a single year. More elements means more components that each need proper labels, roles, and keyboard support to be accessible.
- ARIA usage across websites
ARIA attributes are meant to make complex interfaces understandable to assistive technology, but they only help when applied correctly. This points to widespread misuse: incorrect roles, redundant or conflicting attributes, and ARIA layered onto elements that didn’t need it.
- Third-party frameworks
AI is outpacing the human attention needed to make it usable for everyone, widening the gap between how fast sites are built and how accessible they actually are.
While these trends make compliance harder than ever, they don’t lessen the stakes. The cost of an accessibility lawsuit often far outweighs the time, money, and effort it takes to reach a compliant status, which is exactly why web accessibility needs to be prioritized, not deferred as pages grow more complex.
Accessibility Scores: A Global Breakdown
Of all the websites that we analyzed, it was found that the vast majority of compliant websites with the highest accessibility scores were North America, strongly followed by Africa.
Countries that stood out the most were Canada and the United States. Close behind was Germany, South Africa, the United Kingdom and Russia.
Thereafter, Brazil, Sweden, Germany, Japan, UK, Singapore, Belgium, Spain, India, Poland, France, Finland, Denmark, Australia all clustered between 24 and 27 .
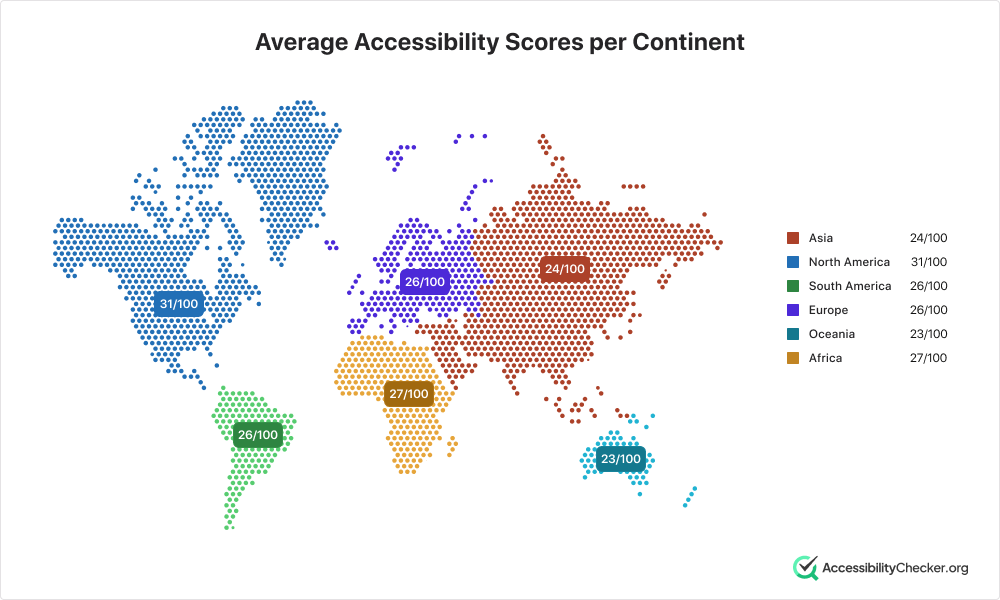
Breaking the scores down per continent, we can see that America and Africa have some of the higher average accessibility scores. North America showed an average of 31/100, Africa 27/100, Europe and South America 26/100, Asia 24/100 and Oceania 23/100.
eCommerce Under the Microscope: Compliance Status
The compliance picture for eCommerce websites in 2026 is getting worse rather than better.
Online stores, being some of the worst offenders, are averaging between 76-85 errors per page, depending on the platform being used. The usual reasons are missing image descriptions, hard-to-read text, and checkouts that don’t work with screen readers.
Michael Taylor, a blind screen reader user who writes about e-commerce accessibility for UsableNet, described exactly this problem when ordering food online.
I ordered from a pizza chain a couple of weeks ago and went with the default address because everything I heard sounded correct. Two hot pies showed up at my aunt’s house, about an hour away from where I live. The address picker accessibility bug cost me an actual meal that day.
He explains the root cause in plain terms and that is that the screen reader couldn’t tell the options apart:
In two separate orders, my screen reader announced every saved address in the list exactly the same way, even though they were visually different.
| eCommerce Platform | Compliant | Partly Compliant | Not Complaint |
| SquareSpace | 5.39% | 48.69% | 45.92% |
| Magento | 0.57% | 5.97% | 93.47% |
| BigCommerce | 0.83% | 4.96% | 94.21% |
| Webflow | 3.28% | 31.17% | 65.54% |
| Shopify | 15.38% | 27.56% | 57.06% |
| Drupal | 9.98% | 28.12% | 61.09% |
| Woocommerce | 1.5% | 14.46% | 84.04% |
| Other | 5.15% | 31.44% | 63.42% |
Like WordPress, platforms such as Shopify offer plugins that make accessibility compliance considerably easier to achieve. These won’t take a site all the way to full compliance on their own, but they move it a meaningful step closer to being more user-friendly and inclusive.
Real change starts with awareness and eCommerce site owners in particular need to do more if the current average compliance scores are going to improve.
What about other CMS Websites?
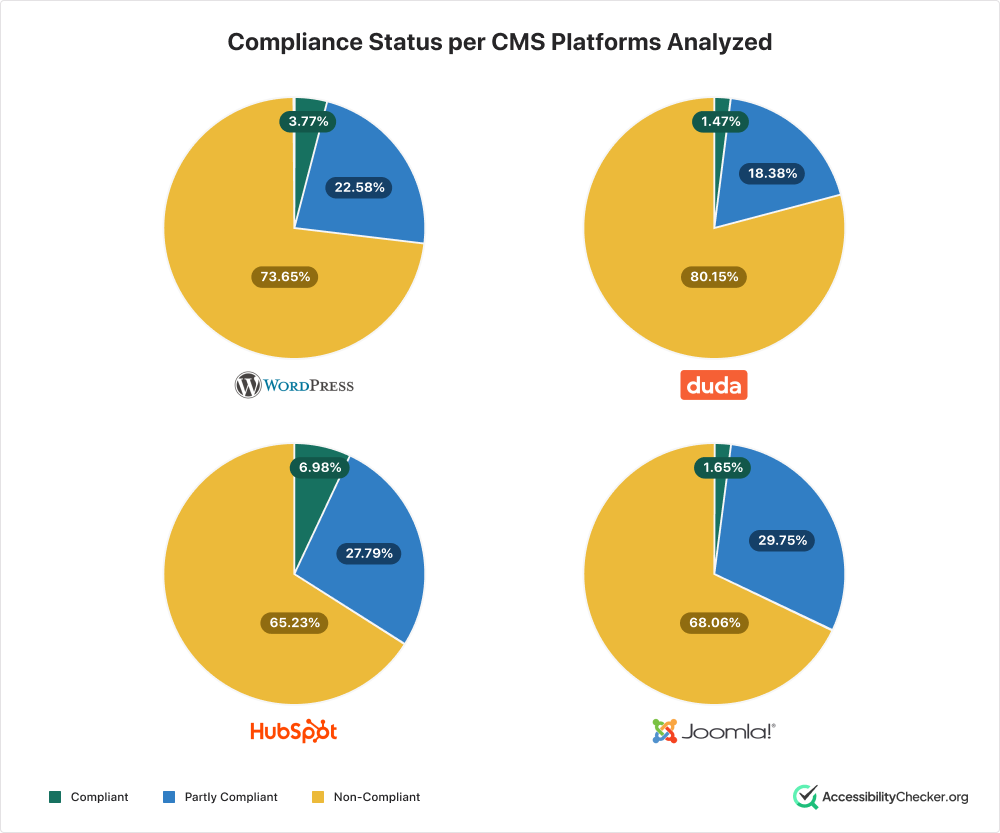
Websites that are built on CMS platforms such as WordPress make web accessibility compliance easier thanks to plugins and other tools.
However, there are still a large number of websites that remain non-compliant or partly compliant, both of which leave them vulnerable to accessibility lawsuits.
| CMS Platform | Compliant | Partly Compliant | Not Compliant |
| WordPress | 3.77% | 22.58% | 73.65% |
| Duda | 1.47% | 18.38% | 80.15% |
| Hubspot CMS | 6.98% | 27.79% | 65.23% |
| Joomla | 1.65% | 29.75% | 68.06% |
Accessibility Compliance by Industry
While there are compliant websites across multiple verticals, some sectors stood out from the rest.
Out of the websites we analyzed, we found that the Education, Construction, Manufacturing/Industrial, Pet Services, Real Estate, Automotive, and the Travel & Hospitality sectors had the highest levels of non-compliance.
Food and Beverage, Beauty and Personal Care, and Sports and Fitness sectors followed closely behind.
The highest accessibility sectors we found were Legal, Marketing, and eCommerce/Retail.
Final Thoughts
Every site in this study, regardless of platform, industry, or country, exists to be used by people, and an inaccessible site quietly excludes a meaningful share of its potential visitors, customers, and employees before they ever get a chance to engage. That exclusion carries real business costs too such as lost conversions, higher legal exposure, and reputational risk as accessibility becomes a baseline expectation rather than a differentiator.
Accessibility determines whether over a billion people worldwide with a disability can actually use a website at all by reading it with a screen reader, navigating it by keyboard, and understanding it despite color blindness or low vision, or complete a purchase without a mouse.
In summary, the platform gap we found is that it shows accessibility is substantially solvable through better defaults and deliberate design choices, not an unreachable ideal, which makes the 65% non-compliance rate in this study less a verdict on what’s possible and more a sign of how many easy fixes simply haven’t been made yet.
Want to know where your own site stands? Click here to run a free accessibility scan of your website.